PROJECTS / CARTOGRAPHIC GROUNDS
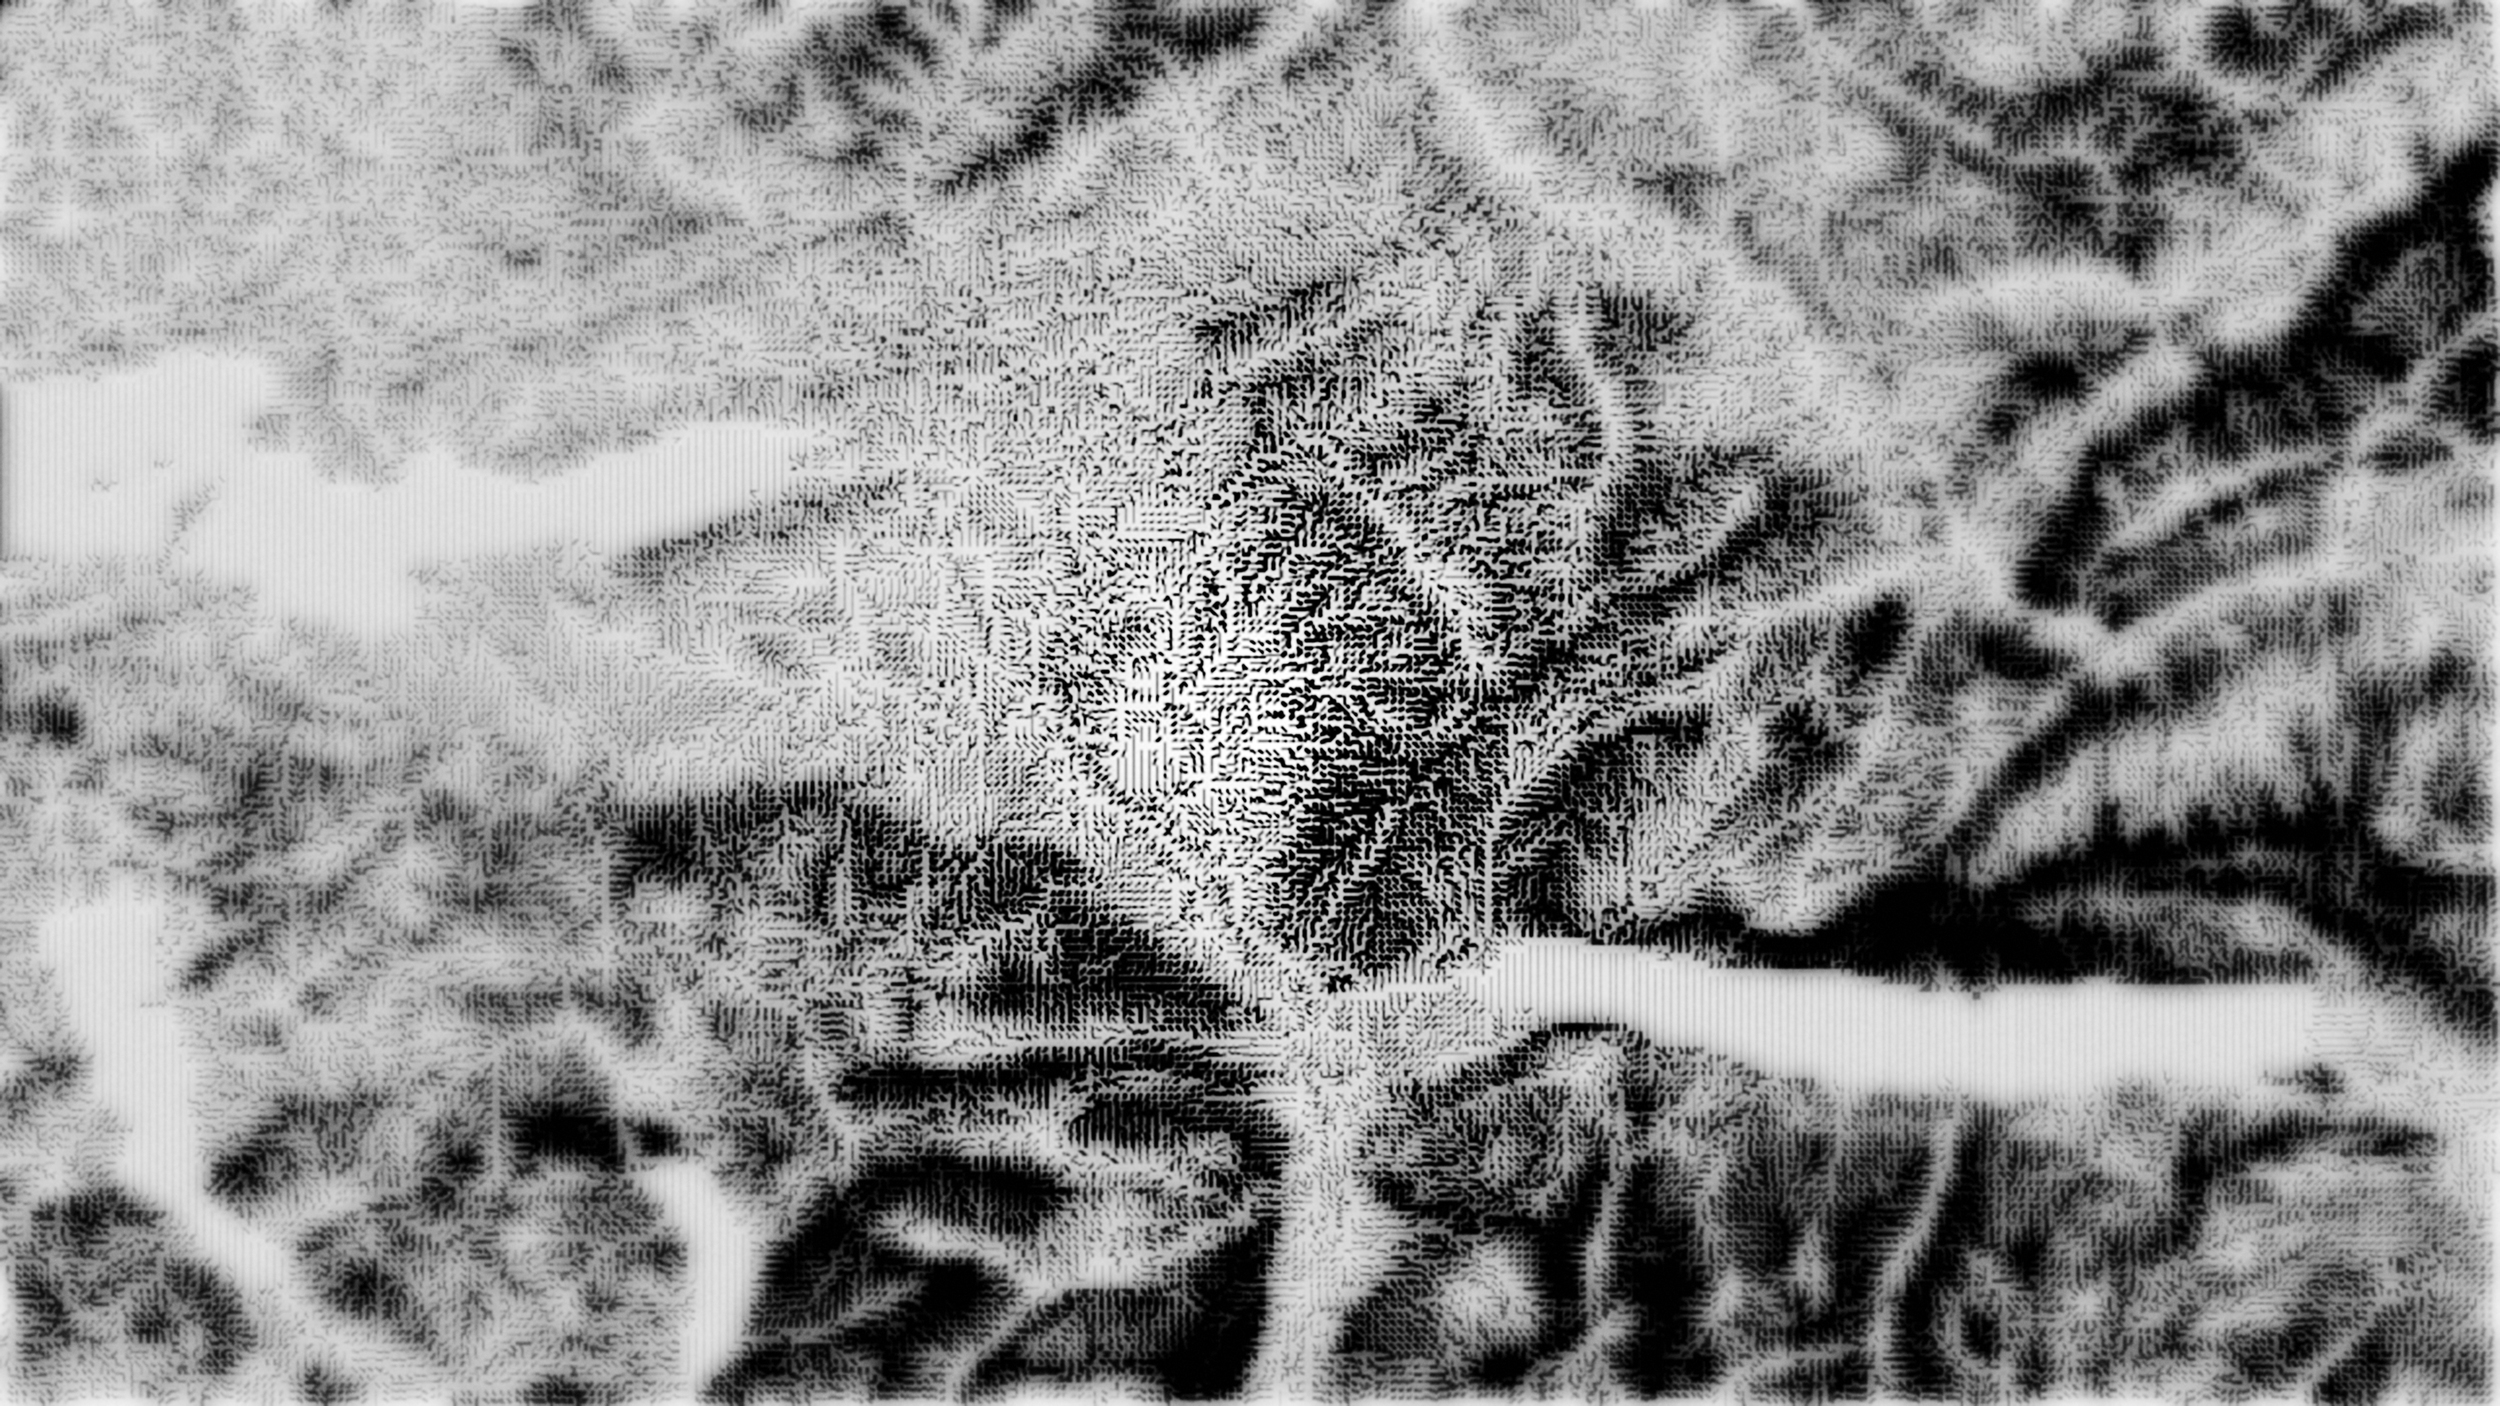
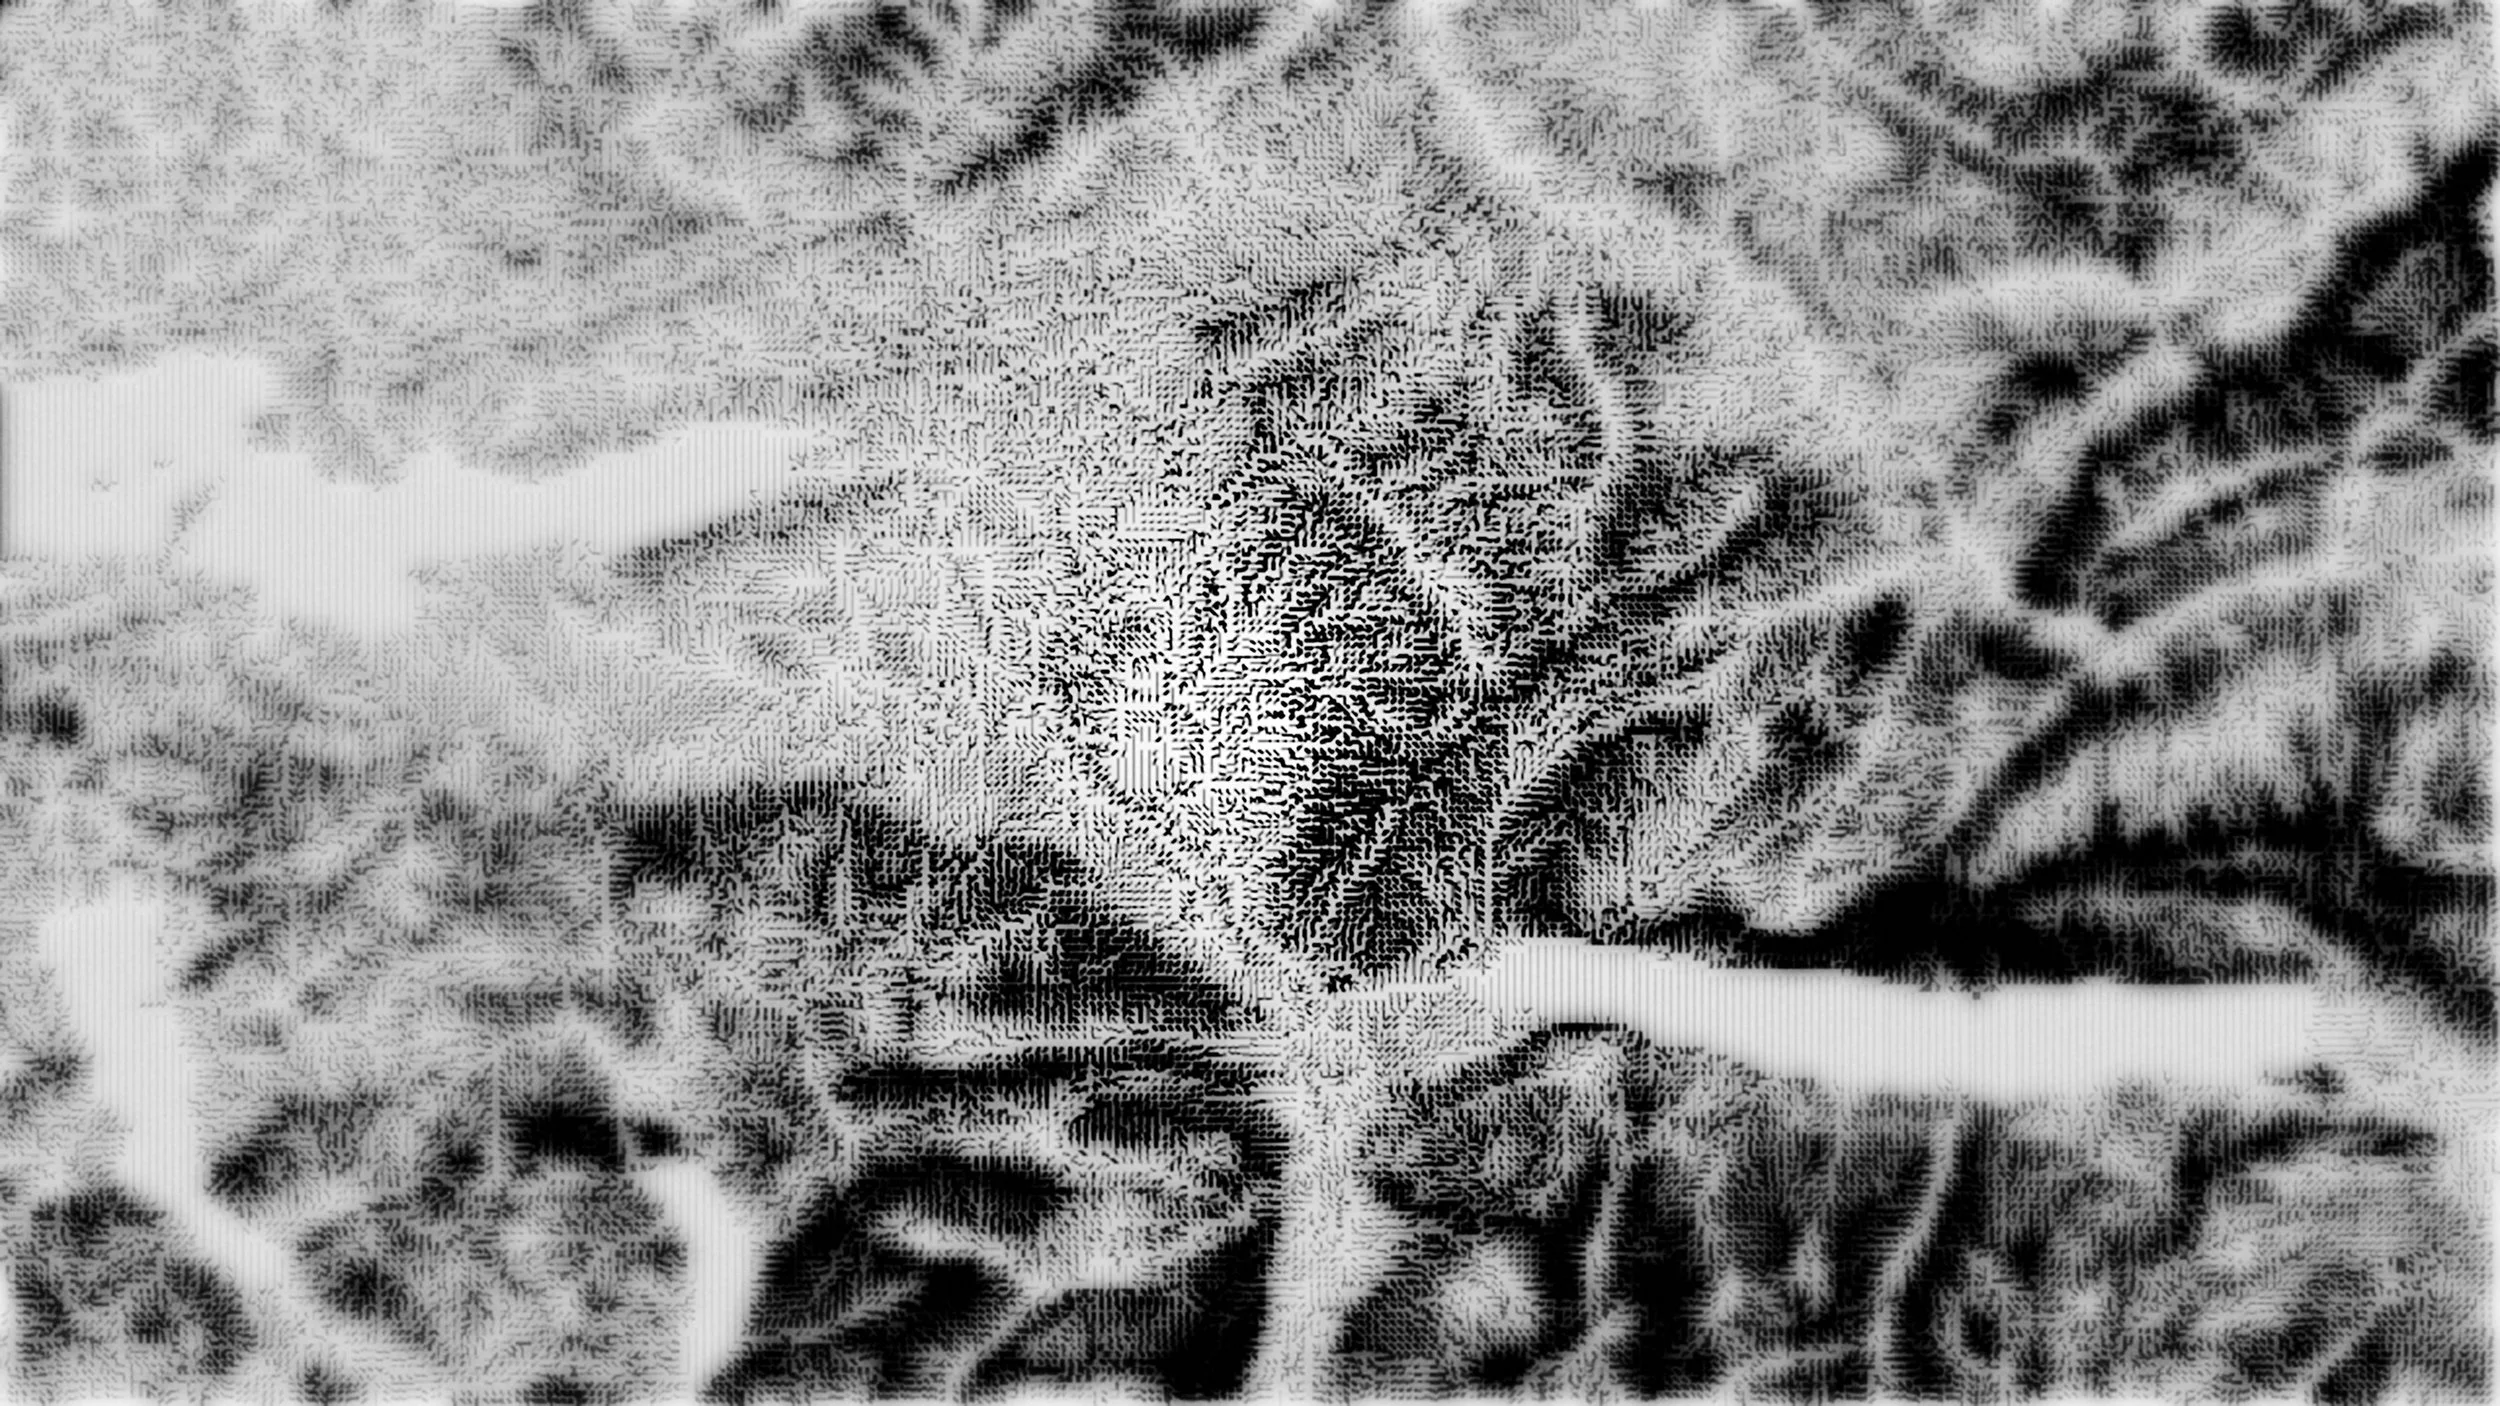
Cartographic Grounds is a four channel video piece that explores a canon of cartographic representations. Each channel begins with a single base map whose representational approach is then deconstructed and extrapolated upon. These base maps are terrain of the Swiss Alps by Euard Imhof, a figure-ground map of Barcelona by Joan Busquets, and a stratigraphic map of Paris geology by Jean-Pierre Gely. Each provide a starting point for a separate graphic exploration—survey points, contours, sectional profiles, hachure, hill shade, figure ground, and explorations of the epistemology of map legends. This project was especially rewarding; after several years of working with mapping and cartographic representation, these pieces forced a certain reconciliation of the various tools W.O. use to create our work— coding, on the one hand, and more standard design software on the other. Before developing the visualization techniques used in the pieces, there were several weeks of experimentation with code attempting to translate the surface of these other designers’s maps into a form that could be extrapolated upon computationally. In this process, new algorithms were implemented to explore contouring and hill shading. This was not just a technical project; these implementations required a detailed inspection of the physical maps which revealed the balance of rationalized procedures and manual craft they required. This has not only informed W.O. design practices but has unexpectedly contributed to my historical research.
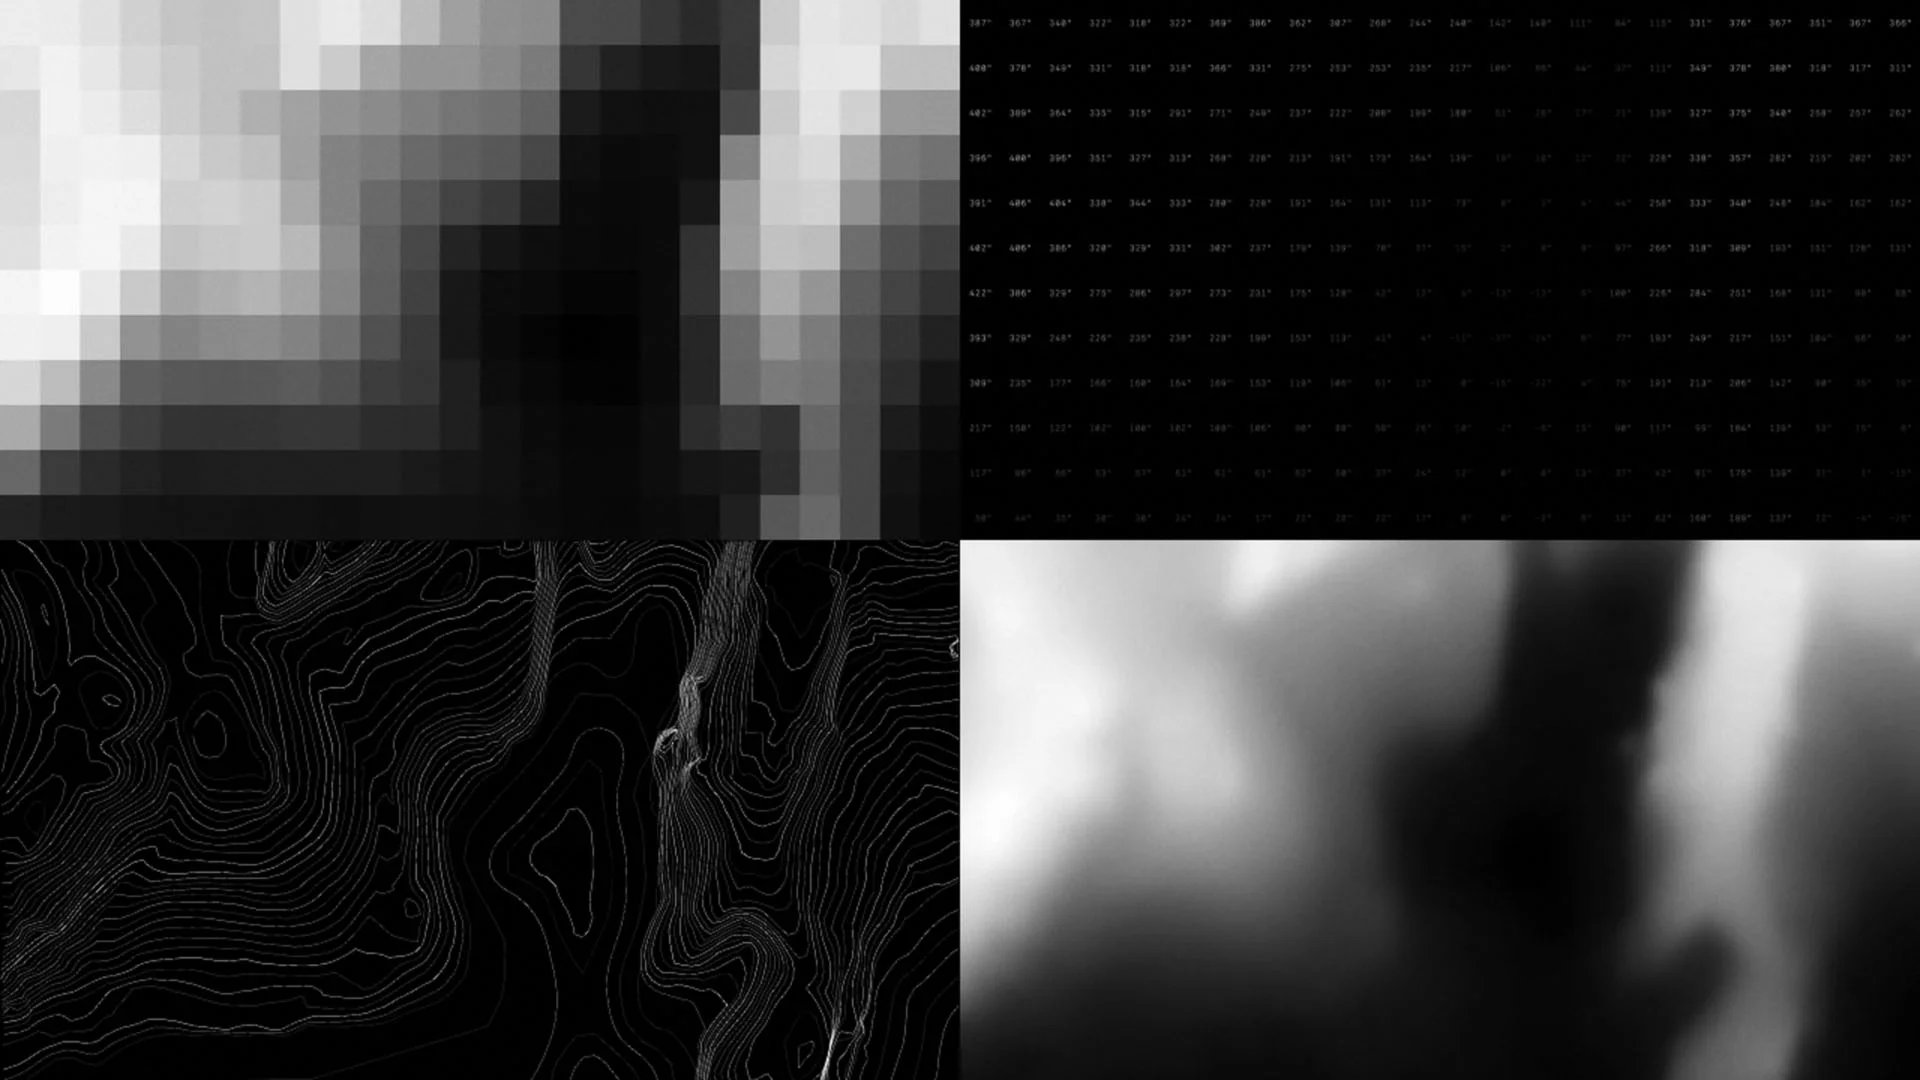
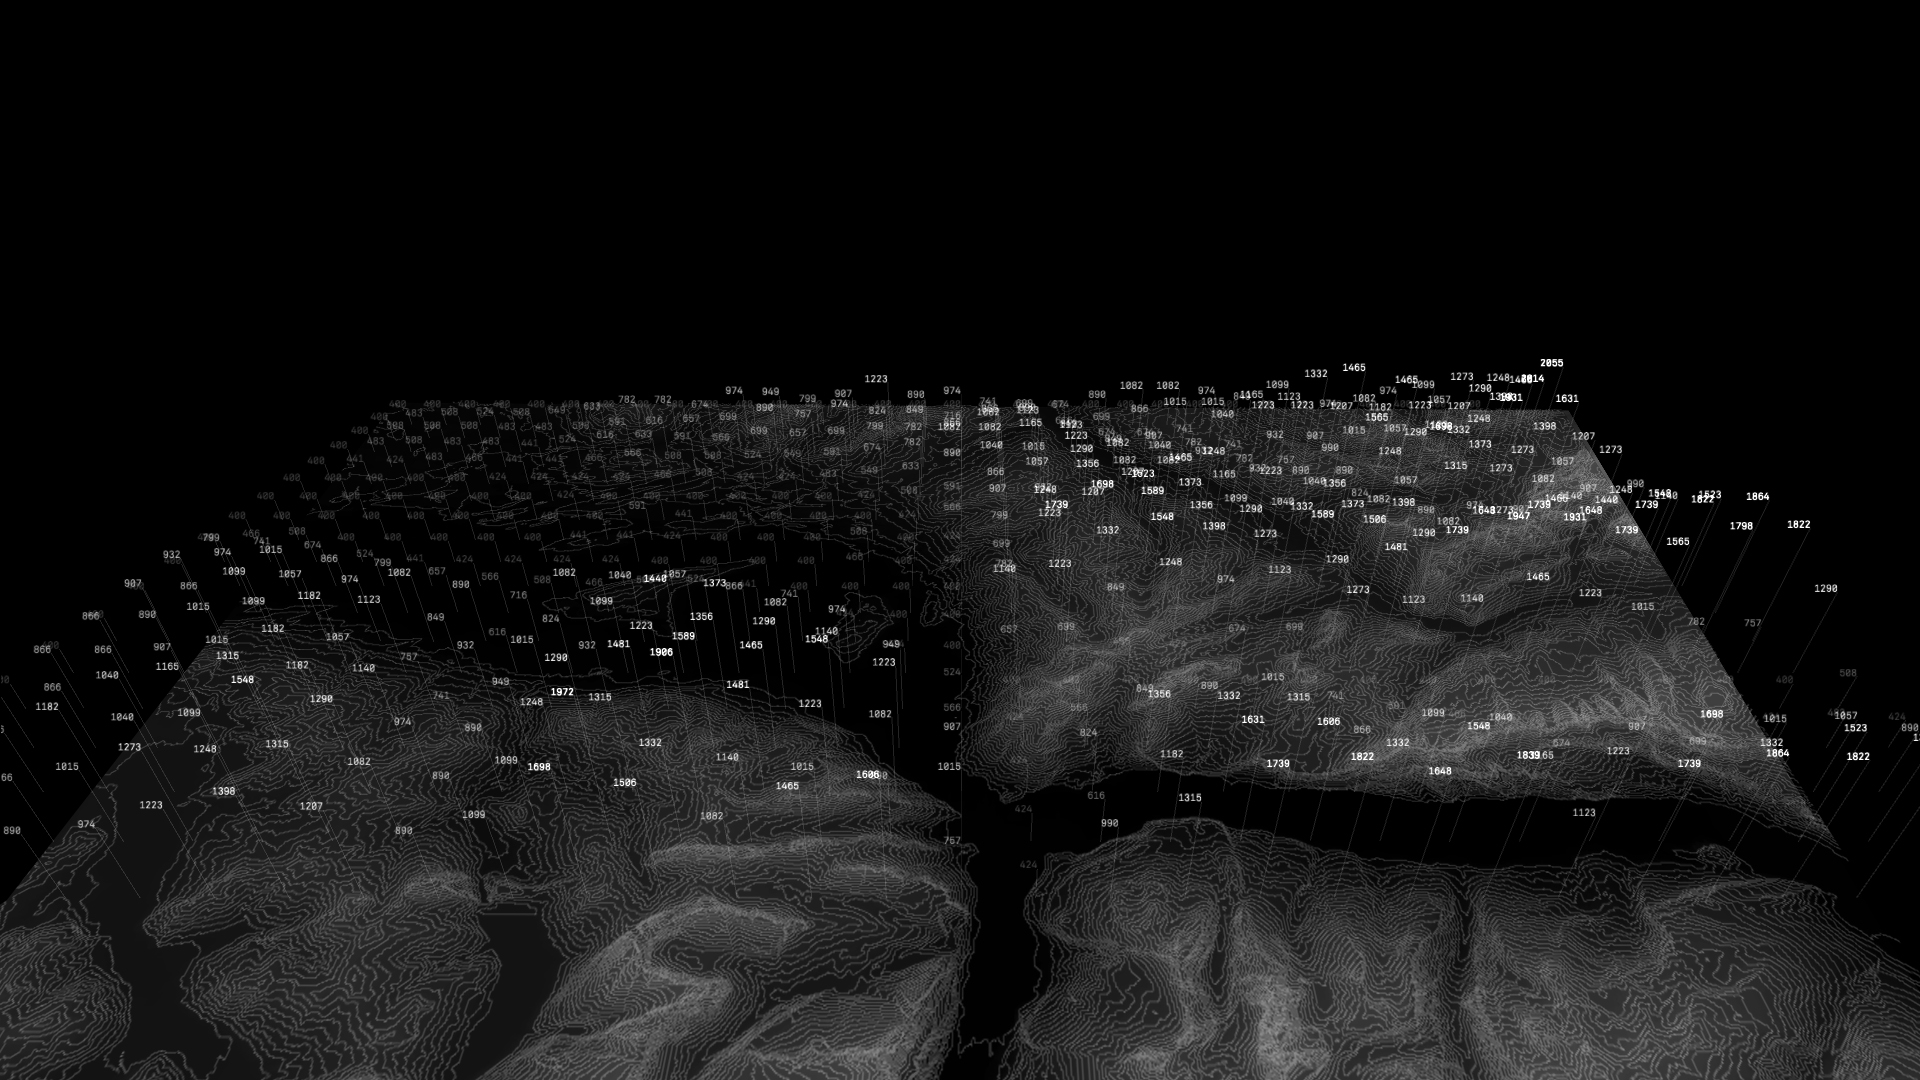
Using a digital elevation model of a portion of the Swiss Alps, Terrain Technique is a cartographic animation that explores several conventional methods of representing elevation data— survey points, point cloud, contour line, sectional profiles, hachure, and hill shade. The scene progresses continuously through these techniques by demonstrating how the previous technique can be transformed into the following technique, moving from the most abstract to the most photo-realistic. As an example, the scene opens with a matrix of evenly spaced survey points with counters all initialized to zero. There is no indication that this represents a ground condition. The counters all increment to their elevational measurement value, while displacing the points in the z direction. With the scene still in an a planar projection, the viewer is unable to perceive this motion—only the numbers themselves, and a slight color shift, indicates that there is a differentiation among the points. The scene then rotates into a perspective view and reveals that the survey points are also a point cloud, describing a complex terrain in all three dimensions. Similar transitions happen between the remaining techniques: sectional profiles splitter, rotate, and become a hachure pattern. The hachure pattern realigns, and thickens into the pencil-strokes of a hillside, and so on. With each transition, a new reading of the ground is possible, while still retaining the persistent identity of that ground.
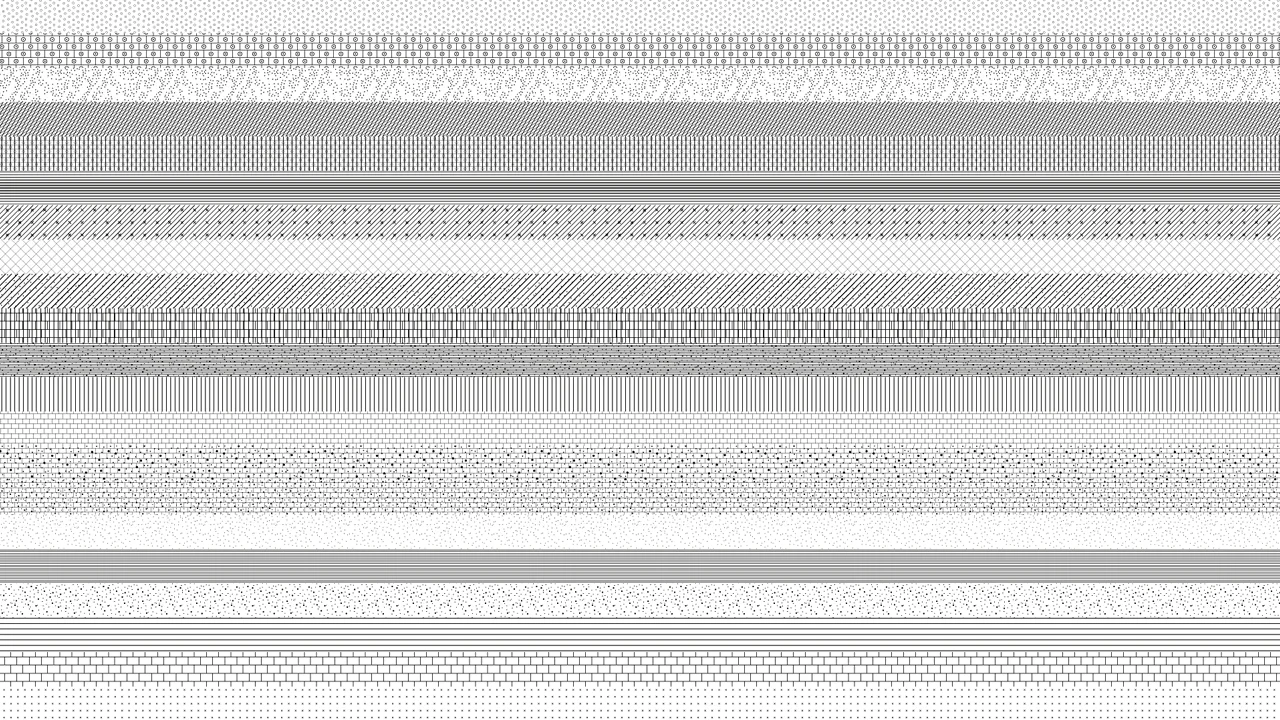
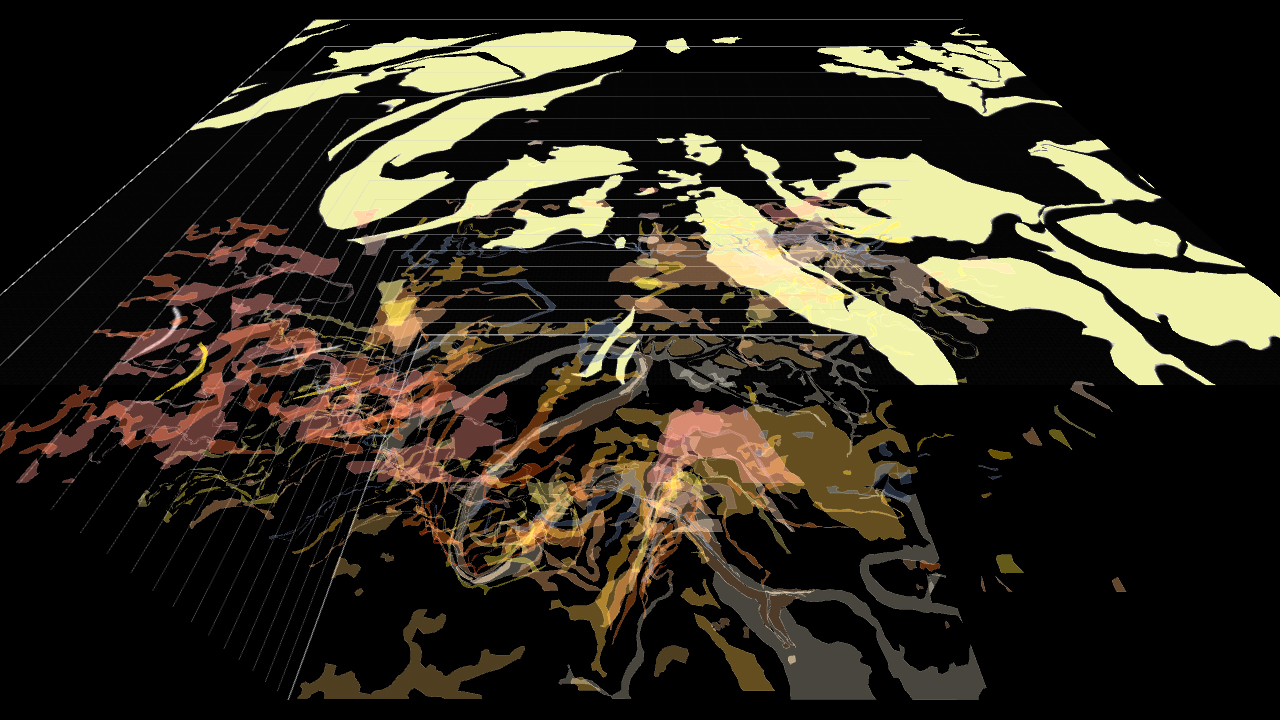
This scene begins with a stratigraphic map of Paris surface geology. It interprets the map’s several keys and legends as completely independent representational systems— each imply a certain way of reading what is below the ground’s surface. The map’s legend equates color with a particular rock formation, with the added detail of geologic era and surface depth. A second legend shows a sectional cut through the geology that depicts a standardized order of geological layers.Therefore, a single map color implies a timeline, a depth or thickness, and a location within a sectional hierarchy of layers. The animation explores each of these implications, transitioning continuously between them. The map’s various color patches are peeled apart in the z direction. When shown in elevation, this creates a geologic timeline with different layers conforming to different standardized time periods. These layers then extrude to the surface depths implied by the legend. Lastly, a speculative section is incrementally cut through the map surface, revealing the standardized section at each location on the map as determined by the sectional legend. While didactic in purpose, the animation is also meant to treat the surface of the map experimentally, using design as a methodology to unpack and critique its various sign systems, highlighting their competing descriptions of what lies beneath both the map’s surface and the surface of the ground.
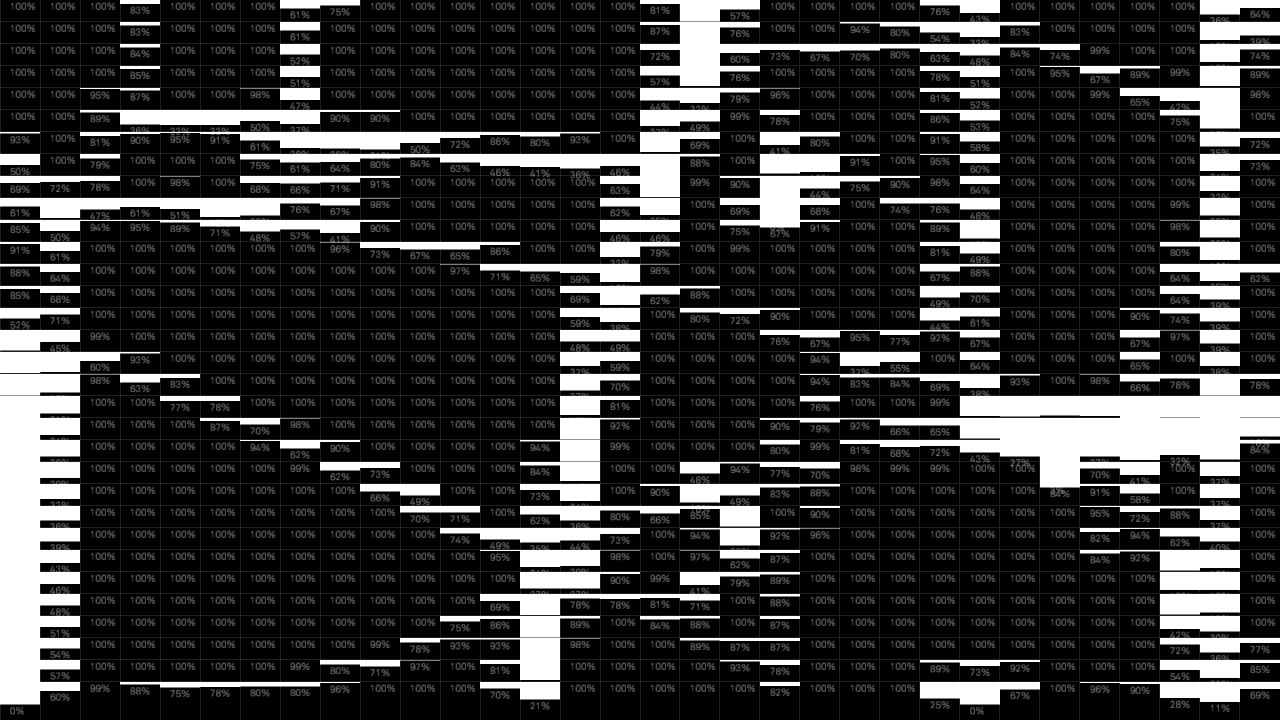
This scene explores the technique of figure / ground at various spatial resolutions. Using Barcelona as a base map, the city is rendered in black and white figure/ground. In several passes, fewer and fewer details from the ground are maintained. At the first scale, alleyways, small streets, and individual buildings are shown. At the coarsest scale, only the broad urban block structure of the city remains. With each scalar transformation, the map toggles between a cartographic view and a abstracted diagram that takes a numerical account of what is figure and what is ground. To create this diagram, the map is resampled into bins that show the proportions of figure and ground throughout the map. In the visualizations final moment, the city is rendered as two simple bars, one white and one black, that show the proportion of what is figure and what is ground for the entire map.
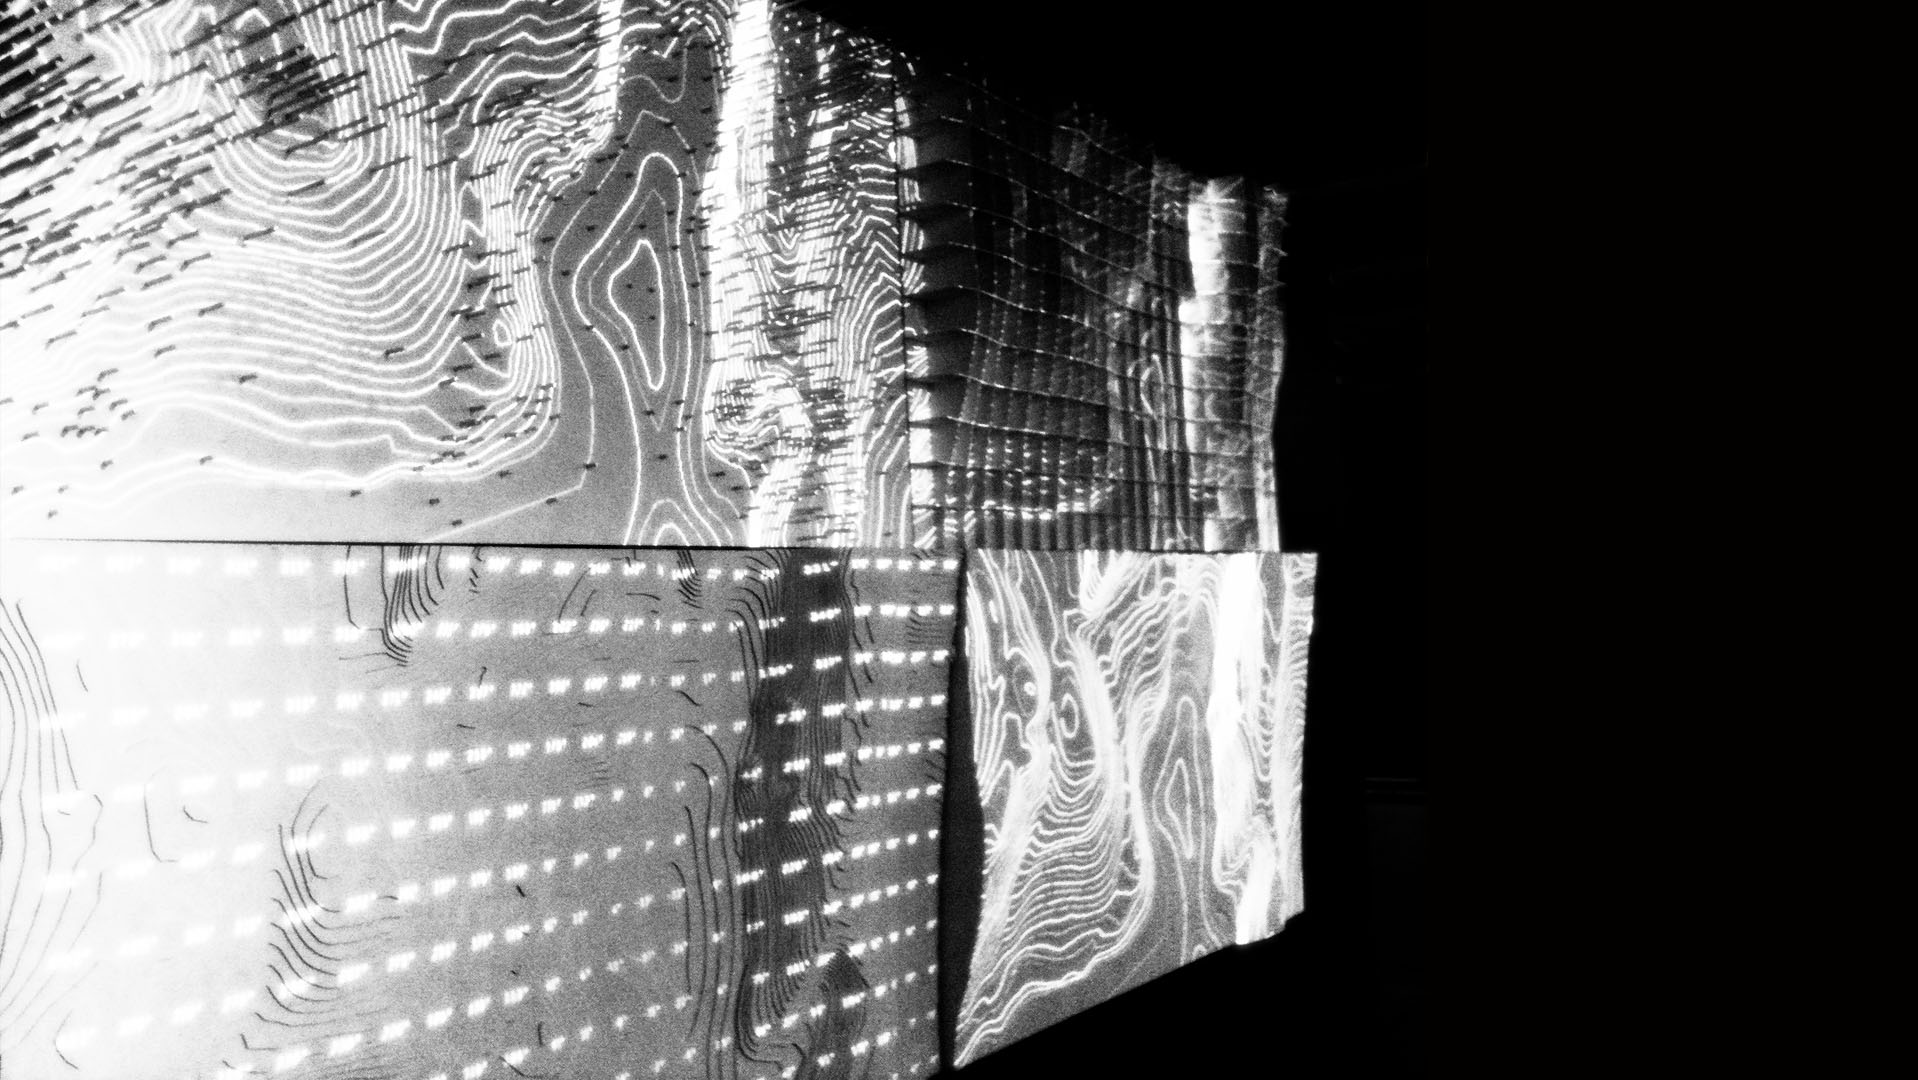
This piece combines a terrain model with a projected cartographic visualizations. A small selection of New York’s Central Park was represented with four different modeling techniques: a contour model, an egg crate model, a continuously milled surface, and a ‘sounding model,’ a more experimental technique that equated elevation with a density rods that act as surface sample points. The projected visualization depicts the methods of cartographic representation that are conceptually related to these modeling techniques: a contour map, a downsampled raster map, an elevational color gradient, and a matrix of elevational survey points. Over the duration of 15 minutes, the model and the projection go through a full permutation of combinations with each cartographic technique projected on each model sample. The piece extends the ideas of the previously described “Terrain Techniques” video by incorporating 3D representations into the set of practices that can describe the ground in competing and productive ways.
[PROJECTS]
EXHIBITION
29.10.2012 - 01.01.2013
Cartographic Grounds: Projecting the Landscape Imaginary
Drucker Design Gallery
Cambridge, MA


